Dr. Fin Clementwood
Dr. Fin Clementwood
modelling
crystallisation
Polylactic Acid for 3D printing
Dr. Fin Clementwood
modelling
crystallisation
Polylactic Acid for 3D printing
Dr. Fin Clementwood
modelling
crystallisation
Polylactic Acid for 3D printing
ASTHETIC SCIENCE
Polarised Light Microscope X Washing-up Liquid
Location /
Maastricht University
Role /
Team Project
Purpose/
Project period
Year /
2014
Location /
Maastricht University
Role /
Team Project
Purpose/
Project period
Year /
2014
Location /
Maastricht University
Role /
Team Project
Purpose/
Project period
Year /
2014
Location /
Maastricht University
Role /
Project design and lead
Purpose/
Project period
Year /
2014
Dr. Fin Clementwood
modelling
crystallisation
Polylactic Acid for 3D printing
Location /
Maastricht University
Role /
Team Project
Purpose/
Project period
Year /
2014
Dr. Fin Clementwood
modelling
crystallisation
Polylactic Acid for 3D printing
Location /
Maastricht University
Role /
Team Project
Purpose/
Project period
Year /
2014
Dr. Fin Clementwood
modelling
crystallisation
Polylactic Acid for 3D printing
Location /
Maastricht University
Role /
Team Project
Purpose/
Project period
Year /
2014
Dr. Fin Clementwood
modelling
crystallisation
Location /
Maastricht University
Role /
Team Project
Purpose/
Project period
Year /
2014
Dr. Fin Clementwood
modelling
crystallisation
Location /
Maastricht University
Role /
Team Project
Purpose/
Project period
Year /
2014
Dr. Fin Clementwood
modelling
crystallisation
Location /
Maastricht University
Role /
Team Project
Purpose/
Project period
Year /
2014
Dr. Fin Clementwood
modelling
crystallisation
Location /
Maastricht University
Role /
Team Project
Purpose/
Project period
Year /
2014
Dr. Fin Clementwood
modelling
crystallisation
Location /
Maastricht University
Role /
Team Project
Purpose/
Project period
Year /
2014
Dr. Fin Clementwood
modelling
crystallisation
Location /
Maastricht University
Role /
Team Project
Purpose/
Project period
Year /
2014
BACKGROUND
Polarised light microscopy THEORY + microscopy
Process of utilising it & Rachel discovered it
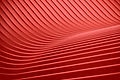
Stunning images with vivid colours that shifted when the bubbles popped and moved. The result is a vivid array of textural and unfamiliar streaks of light, shadow and refracted patterns. The shapes of other bubbles are reflected, amplified and diminished like small lenses.
[Add watermark to images]
Polylactic Acid for 3D printing
Polylactic Acid for 3D printing
Polylactic Acid for 3D printing
Polylactic Acid for 3D printing
Polylactic Acid for 3D printing
Polylactic Acid for 3D printing
Dr Fin J Hazelwood
chladni plates
MATLAB X Chladni
BACKGROUND
When a plate dusted with grains of sand or salt is placed on top of a bass speaker creating vibrations, fascinating patterns are created.
THEORY
These patterns shift as the frequency of the vibrations change, causing the grains to leap up and down on the plate until they come to settle in specific locations. The gif below illustrates how these patterns can change when frequencies vary. The result are mesmerising shifting behaviours.
Location /
Maastricht University
Role /
Independent project
Purpose/
Report paper for the Physics Vibration and Waves course
Year /
2013
Supervisor/
HOW
I learned about chladni plates from an old YouTube video and it struck me as something fascinating and unusual so I wanted to learn more about it. However, despite watching videos and reading articles I wanted to understand the dynamics better.
During my undergraduate degree I took a physics course called Vibrations and Waves which covered a lot of theory needed for further physics courses and principals. Amongst the midterm exams, problem based learning assignments, and other concurrent courses, we had a graded task to create a vibrations and waves based project.
I had not previously used MATLAB but I was aware it was an important tool in scientific research, so I thought that this would be a good opportunity to learn. Knowing that it was good software for visualisations and graphing, the idea to model these patterns became something highly interesting.


PROCESS
After much research and some late nights with YouTube tutorials I had gained a good basic understanding of MATLAB and could start to research what other people had achieved in this area. I found some great papers which helped to inform me how I could structure my own approach. The images above show some of the outcomes I achieved with MATLAB.
Since I have done this project there are some great resources that have since been created. The images below demonstrate a model advanced modelling of the patterns.

Source: Oliver Knill, differential geometry in graphs from http://people.math.harvard.edu/ An animation showing how the chladni figures form.
OUTCOME
The outcome was two-fold - first being the model created in MATLAB and the second being the academic report detailing the process and results. This was quite an ambitious project, especially as I did it alongside so many other academic commitments (i.e. Data Structures and Algorithms and Narrative Media) in 2 or 3 weeks but it was a great experience and I was pretty happy with the outcomes.
